

How Vaultis Models a P&G Retirement, Decision by Decision
/A Procter & Gamble retirement is a series of interrelated decisions, each of which changes the others. What leaves the PST and the Savings Plan, and in what form. Whether to use NUA, and on which shares. When to exercise LTIP options that run for eight more years. Which account pays for each year of spending, and in what order. How the investment allocation is built once the P&G position is accounted for.
The distribution decision sets what sits in each account. What sits in each account sets where lifestyle comes from and how much bracket room is left. Bracket room sets the option schedule and the conversion calendar. Each decision compounds on the one before it, so we model them together, in one analysis, and revisit the whole stack when any piece moves. This article walks through how that is done for a household drawn from the patterns we see in P&G families, not from any one client. The figures are assumptions chosen to be realistic, and the P&G price used throughout is $157.

The Household
Mark is 60 and has spent 31 years at P&G. Dana is 58 and has worked throughout her career, most recently with a 403(b) through her employer. Both retire in March 2027.
| Account | Balance | Notes |
|---|---|---|
| PST, P&G preferred shares | $1,083,300 | 6,900 shares at $157; cost basis $47,058 ($6.82 a share) |
| PST, P&G common shares | $1,004,800 | 6,400 shares at $157; aggregated cost basis $640,000 ($100 a share), accumulated over 30 years of contributions and reinvested dividends |
| PST, diversified funds | $650,000 | Moved out of P&G stock over the years since age 45 |
| Savings Plan | $620,000 | Including $45,000 in Roth 401(k) |
| Dana's 403(b) | $480,000 | |
| Joint brokerage account | $800,000 | $520,000 of basis; no P&G |
| Roth IRAs | $110,000 | |
| Cash | $120,000 | |
| Accounts total | $4,868,100 |
Mark also holds seven LTIP stock option grants covering 26,000 shares, with strikes from $80.00 to $173.00 and expirations from February 2028 to October 2035. At $157 the grants carry about $789,000 of spread before tax.
The household wants $15,000 a month before tax, rising with inflation. Social Security is assumed at full retirement age: roughly $4,100 a month for Mark at 67 and $2,800 for Dana on her own record at 67. Deferring either benefit to 70 is noted as a decision ahead.
Counting the P&G shares in the PST and the option spread, a little over half of this household's wealth is P&G. That figure runs through every section that follows.
The Planning Analysis
The first document a household receives from us runs three to eight pages. It lays out the baseline assumptions, two or more scenarios, a scorecard comparing them, a year-by-year table of where each dollar comes from, the items still open, and our recommendation. It is built to be read in one sitting and argued with.
Three inputs sit underneath everything in it: the return on the portfolio, the path P&G's price takes, and how much the household spends. For Mark and Dana, one percentage point of portfolio return moves the after-tax result at age 95 by about $5 million to $7 million. A flat P&G price instead of a rising one costs about $1.4 million, a falling one about $2.5 million. Spending $2,500 a month more or less moves it by about $4 million in either direction. The IRA decision below, the largest of the tax choices, is worth about $611,000. Each of the three inputs is revisited every year. That doesn't make the tax decisions small. In a household like this one, the PST distribution, the option schedule, and the Roth conversion calendar can shift the pre-tax balance at age 75 by several million dollars and change what a surviving spouse pays for the rest of her life. It means the tax work is done inside a model where returns, P&G's price, and spending are the things being tested, so that no tax strategy is tuned for a world that doesn't arrive.
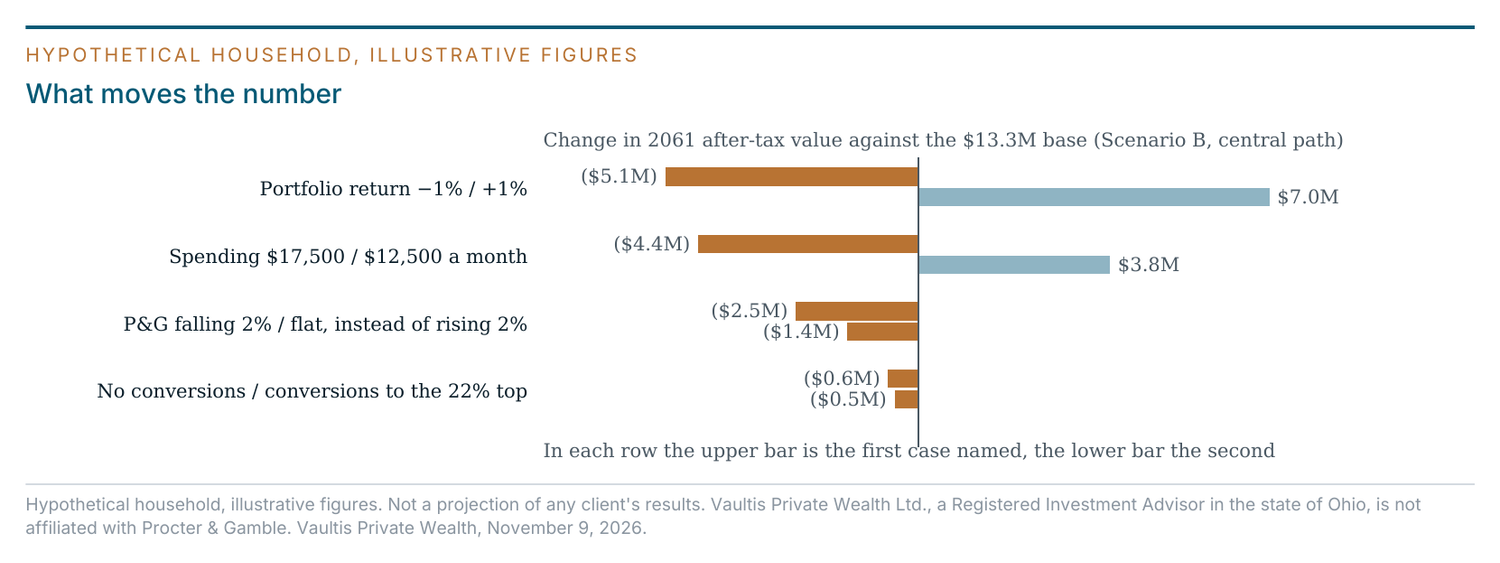
The assumptions for this household are stated on the first page of the analysis, as they are for every client. Non-P&G assets return 5.5% a year. P&G is run on three paths from $157: up 2% a year as the central case, flat, and down 2% a year. Spending is $180,000 in 2027, inflating 2%, with income tax and Medicare surcharges paid on top. None of these is a prediction. They are the settings the scenarios are compared under, and they are the first thing revisited each year.
The model runs to age 95, with check-ins at 85, 90, and the other points where the picture changes: the first Social Security claim, Medicare enrollment, the first required distribution. Execution runs year to year. The first three years are specified to the account and the dollar: which account pays January, how the tax on that is covered, where the bracket sits in December. Year twenty is a framework. It gives the shape of that decade, and it gets re-specified when the decade arrives with real balances, real tax law, and real spending behind it.
The scenarios inside the analysis all fund the same lifestyle. They differ only in where the money comes from and what that costs in tax. For Mark and Dana, year one is simple: $180,000 of pre-tax need, met from Mark's final quarter of wages, about $40,000 of dividends, and the first scheduled sale of NUA shares, about $148,000, with the IRAs untouched and a small surplus reinvested. Year-one tax is about $37,000, most of it long-term gains tax on that sale. The NUA shares are sold down over seven years, 2027 through 2033, on the same schedule in every scenario, so the concentration comes down the same way no matter what else is chosen. Years two through eight are where the scenarios diverge, because that is when the options exercise, the conversion window is open, and the question of what to do with the IRA has to be answered. Optimizing Retirement Distribution Strategies covers the general logic of sequencing. The analysis applies it to one household's facts.
The PST and Savings Plan Distribution: NUA at Every Setting
The lump-sum distribution is the first decision with a calendar attached, and it has more settings than most people realize. The menu for this household runs from a complete rollover with no NUA at one end to NUA on every P&G share at the other, with the preferred-only election in the middle and the common shares adjustable by count in between. Each setting can be executed with or without the Frank Duke rollback. The answer often sits between the named points: NUA on the preferred plus 2,500 of the 6,400 common, say, instead of all or none. For this household every setting was run through both funding scenarios, and the preferred-only and preferred-plus-2,500 settings finish within $10,000 of each other at age 95, which is the kind of result that tells us the common-share count is a concentration decision more than a tax one.
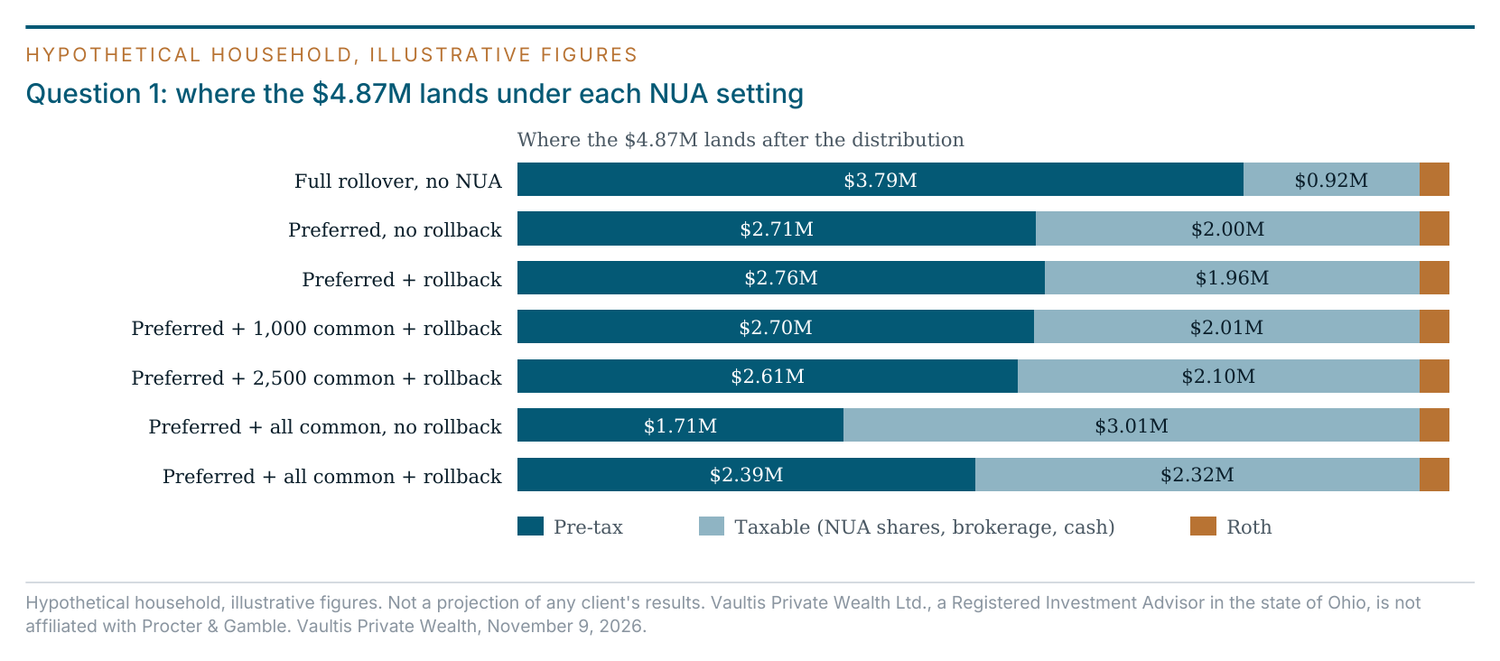
The preferred shares make the case for themselves. NUA on 6,900 preferred shares distributes $1,083,300 of stock with $47,058 of cost basis. Without the rollback, that basis is ordinary income in 2027, about $11,300 of federal tax at 24%. With the Frank Duke rollback, roughly 300 shares go back to the IRA within 60 days and the 2027 tax on the basis is zero. Either way, about $1.04 million of appreciation sits in a taxable account to be taxed at long-term capital gains rates when the shares are sold. After the rollback the retained shares carry essentially no basis.
The common shares are the harder call. Their basis is $640,000, so NUA on all 6,400 means $640,000 of ordinary income without the rollback, or about 4,400 shares returned to the IRA with it, counting the preferred basis as well, in exchange for moving $364,800 of appreciation out of the pre-tax pool. Deciding how many common shares to include means weighing four things at once. The household's mix of pre-tax, Roth, and taxable assets after the distribution, because every NUA share shifts money from the first bucket to the third. Total P&G concentration, because NUA shares carry near-zero basis and are sold down over several years, so each one added extends how long the household stays concentrated. Future required distributions, because common shares left in the IRA grow there until 75. And lifestyle funding, because the NUA account is where the next several years of spending come from. The right count is the one that balances those four for this household, and it is rarely zero or all. For Mark and Dana, NUA on all the common finishes about $168,000 behind the preferred-only setting under Scenario B, because the conversions already shrink the pre-tax balance and the extra P&G would sit in the taxable account for years at a lower return. When NUA on P&G Common Shares Makes Sense works through the question in detail, and Deciding Whether, and How Much, to Use NUA gives the framework we use to size it.
For Mark and Dana, the setting the model favors, stated as an assumption and not a forecast: a lump sum of both plans in April 2027, NUA on the preferred with the rollback, which moves $1.04 million out of the pre-tax pool at no 2027 tax cost and without using any bracket room, leaving the 24% bracket free for the options and the conversions that follow. The common shares roll to the IRA in kind, where they can be sold on a schedule with no tax friction, and the $45,000 of Roth 401(k) rolls to a Roth IRA. Other settings are reasonable. This is the one that fits the rest of this household's stack.
The mechanics are the same at every setting. A lump sum, both the PST and the Savings Plan to zero in the same tax year, nothing else leaving the plans that year, and the P&G shares moving in kind directly to a taxable account. A partial distribution after separation would use up that triggering event, and since Mark is already past 59½, there would be no later trigger of his own to reopen it.
LTIP Stock Options After Retirement: The Exercise Schedule
Mark's options survive his retirement, but they expire on their own schedule, and every exercise is ordinary income in the year it happens. That income is coming whether the household plans for it or not. The planning question is which year each grant lands in.
| Grant | Strike | Shares | Expires | Plan |
|---|---|---|---|---|
| 2018 LTIP | $80.00 | 3,000 | Feb 2028 | 2028 |
| 2019 LTIP | $100.50 | 3,400 | Feb 2029 | 2029 |
| 2020 LTIP | $113.00 | 3,600 | Feb 2030 | 2030 |
| 2022 LTIP | $128.50 | 5,100 | Oct 2032 | Halves, 2031 and 2032 |
| 2023 LTIP | $145.00 | 3,800 | Oct 2033 | 2033, if in the money |
| 2024 LTIP | $173.00 | 2,900 | Oct 2034 | 2034, if in the money |
| 2025 LTIP | $153.00 | 4,200 | Oct 2035 | 2035, if in the money |
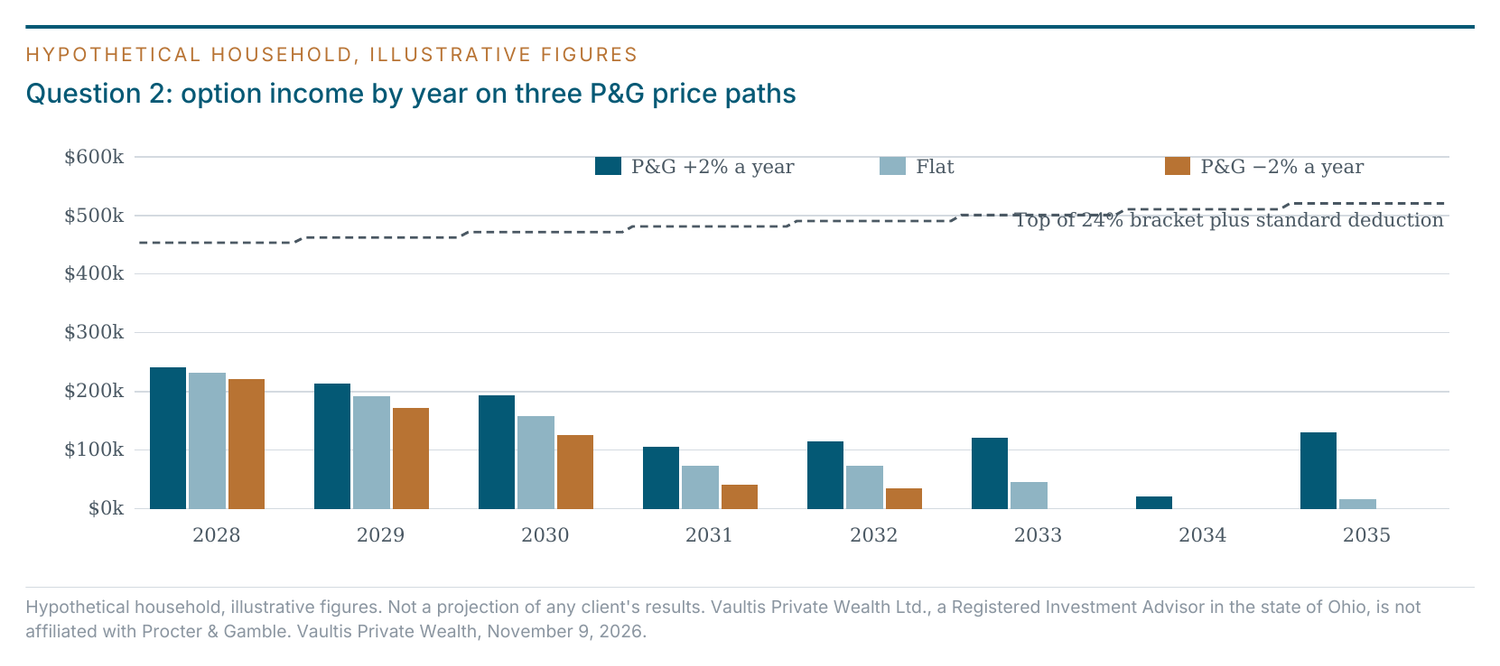
The schedule is managed to the top of the 24% bracket. Each year's exercise is sized to the room that year has, and when a later year looks like it will run past 24% on its own, we pull a grant forward into a year that has room. Sometimes there is no choice. Mark's first three grants all expire in February, which means each of those exercises happens in the first weeks of its year, before the year's other income is known, and the rest of that year's planning works around it. P&G moved its grant date from February to October in 2020, which is why the later grants expire in October and leave more room to time them. P&G's price is part of the decision too. If the stock has run up and we see a reasonable chance of a decline, or we hold a negative view of it, we can accelerate exercises into the current year, take the income at a known price, and leave the later years with more tax flexibility. The schedule in the table is the starting point. It is reviewed grant by grant every year against the actual price and the year's actual income.
The schedule is run on three price paths from $157. On the central case, P&G rising 2% a year, the grants produce about $1.14 million of spread before tax between 2028 and 2035, with the heaviest years in 2028 through 2030. On a flat price, about $789,000, with the 2024 grant expiring unexercised. On a price falling 2% a year, about $594,000, almost all of it in the first three years, and the last three grants expire worthless. Behind those three paths sits a simulation of several thousand possible price paths, which gives each grant a probability of being in the money in its scheduled year. The 2018 grant is near certain, the 2019 grant about 96%, the 2020 grant about 86%. The 2022 grant is about 70%, the 2023 grant about 59%, the 2025 grant about 55%, and the 2024 grant, with its $173 strike, about 45%.
This section comes before the conversion calendar because the options set it. On the central path, the 2028 exercise puts about $240,000 of ordinary income on the return, and the 2029 and 2030 exercises land near $214,000 and $193,000. Those years have less room for Roth conversions than a retiree with no options would have. On the rising path the bracket stays crowded for longer. On the falling path the options contribute almost nothing after 2030 and the bracket is wide open for conversions. Understanding P&G's LTIP covers the grant mechanics.
Roth Conversions Before Social Security: Two Ways to Treat the IRA
After the distribution, the household's money sits in three places. About $1.96 million is taxable: the $1.04 million of NUA shares, the $800,000 brokerage account, and $120,000 of cash. About $155,000 is Roth: the existing IRAs plus the $45,000 from the Savings Plan. And about $2.76 million is pre-tax: roughly $2.3 million in Mark's IRA after the rollover and the rollback, and Dana's $480,000 403(b), rolled to an IRA of her own.
The pre-tax balance is where the conversion question starts. Left alone and compounding at 5.5%, $2.76 million becomes about $5.99 million by 2041, when Mark turns 75 and required distributions begin. His first one would be near $198,000. By the mid-2040s, with Dana's distributions added, the required amounts pass what the household spends: about $290,000 against $257,000 of lifestyle in 2045, $365,000 against $284,000 in 2050, $444,000 against $313,000 in 2055. With Social Security and portfolio dividends on top, income runs well past lifestyle and the excess is taxed and reinvested. That is the pattern worth solving for: not a large IRA by itself, but a required distribution stream that outgrows the household's spending. So the analysis tests two ways to handle it.
Scenario A: leave the IRAs alone. Lifestyle comes from option proceeds and the scheduled NUA sales, then the brokerage account, then Social Security from 2033. The IRAs are untouched until 2041. No conversions.
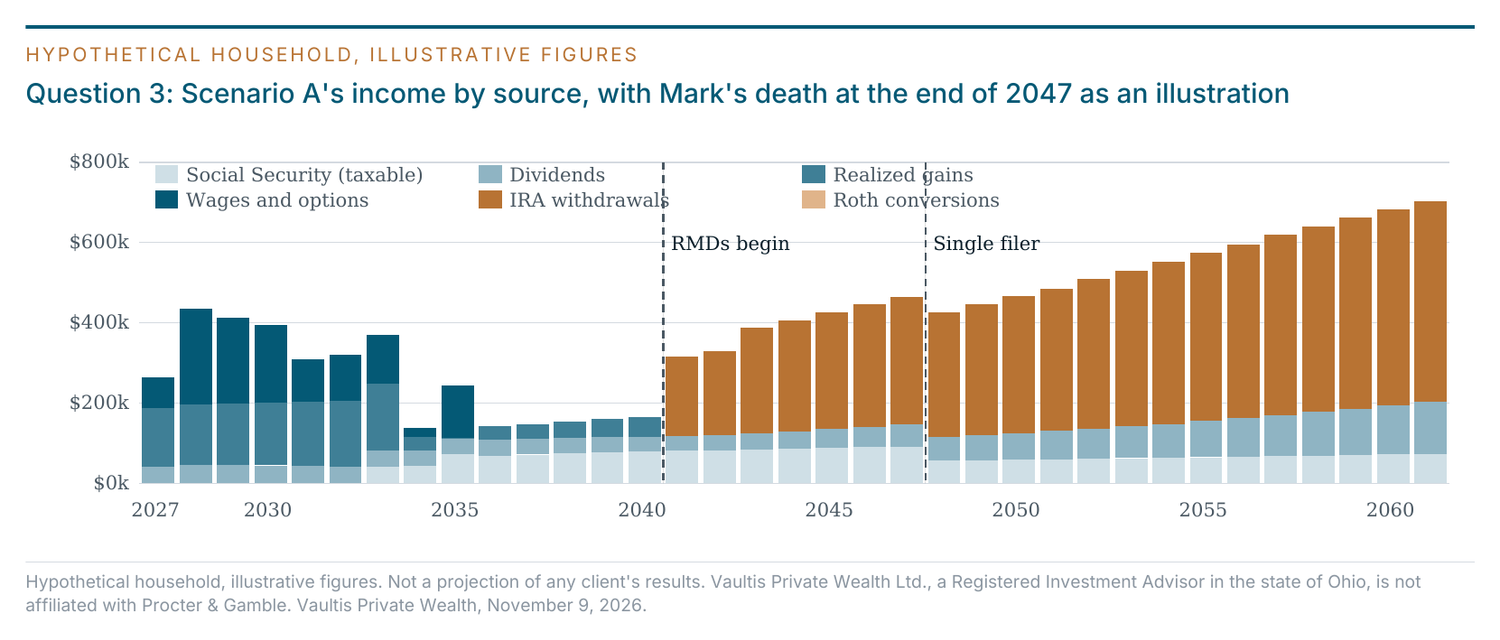
Scenario B: use the 24% bracket while it is available. Same lifestyle sources, with one difference: any shortfall, including the tax the conversions create, is drawn from the IRA inside the 24% bracket before the taxable accounts are touched. The room left in the bracket is converted to Roth each year from 2028 through 2032, the year before Mark's Social Security begins and the bracket narrows. The top of the 24% bracket is $403,550 of taxable income for a married couple in 2026, indexed after that. On the central path the room is about $213,000 in 2028, $249,000 in 2029, $279,000 in 2030, and about $330,000 in each of 2031 and 2032, when the exercises are smaller: about $1.40 million converted in five years, at an all-in cost of about 31%. The last two years cost more per dollar than the first three, because by then the scheduled NUA gains are pushing into the 20% rate and 2031 income sets the Medicare premiums both spouses pay once Dana enrolls in 2033, which is why each December's conversion is sized after realized gains are settled.
Both scenarios pay the same bills. The scorecard compares what they cost and what they leave behind, on each P&G price path. On the central path:
| At Mark's age 75 (2041), central P&G path | Scenario A | Scenario B |
|---|---|---|
| Pre-tax IRAs, both spouses | about $5.99M | about $2.20M |
| Roth IRAs, both spouses | about $350,000 | about $2.98M |
| Mark's first required distribution | about $198,000 | about $49,000 |
| Additional tax paid, 2027 to 2041 | about $557,000 more, most of it 2028 to 2032 |
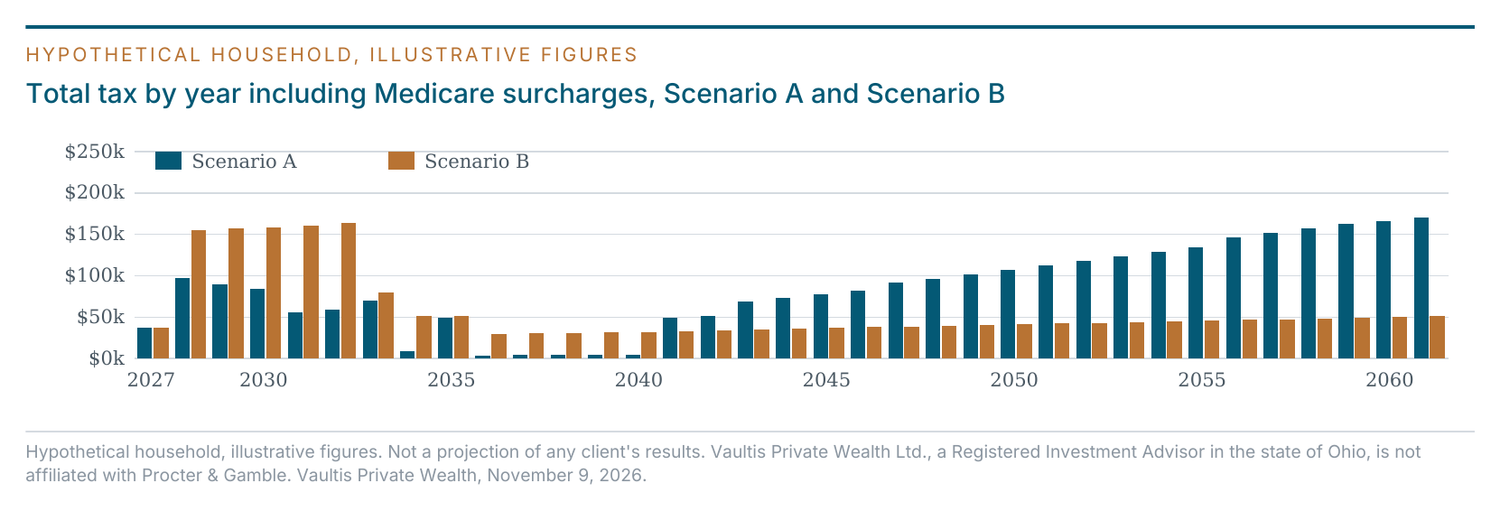
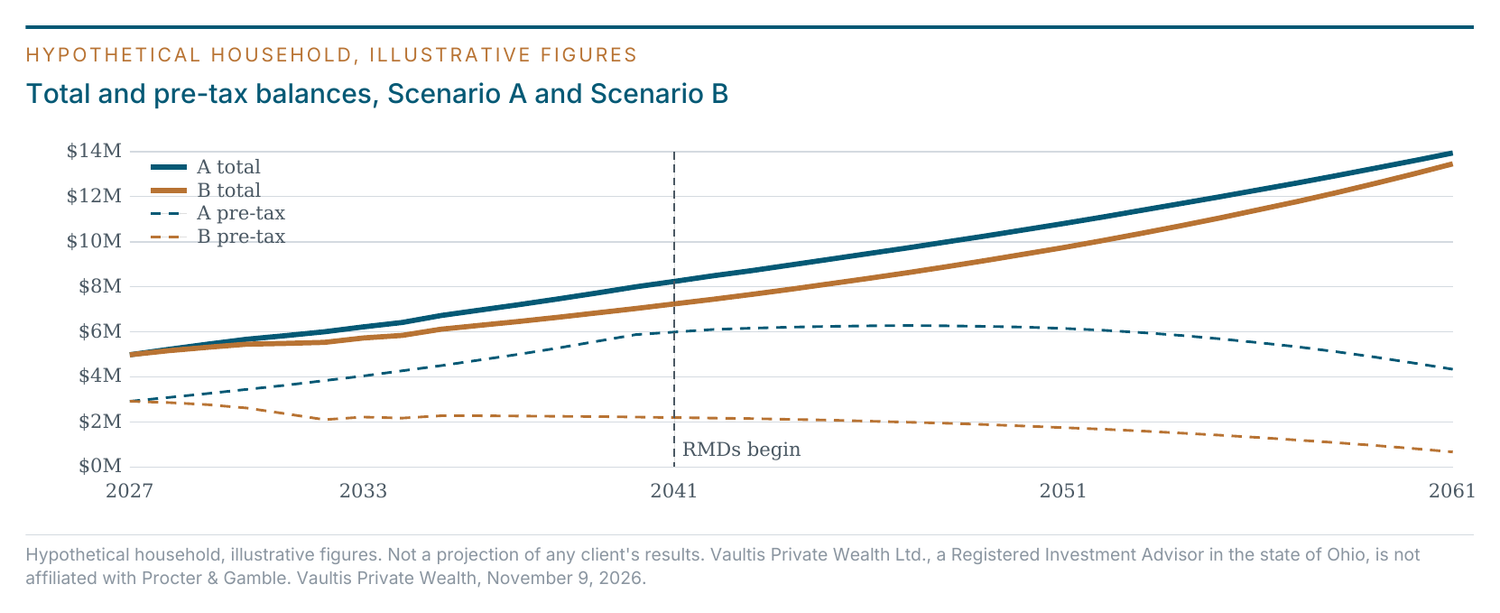
Scenario B pays more tax sooner. What it buys is a smaller pre-tax balance when required distributions begin, a required distribution closer to what the household spends anyway, and lower Medicare premiums in the years those are set by income. It matters most for whichever spouse outlives the other. If Mark dies at the end of 2047 and Dana files alone from 2048, Scenario A's balance produces a required distribution of about $340,000 a year by 2050 on single brackets, taxed at 32%, where Scenario B's produces about $92,000 and stays inside 24%. Medicare surcharges over the plan run about $227,000 under Scenario A and about $47,000 under Scenario B. Scenario B also keeps the conversions inside the window before Social Security and before the Medicare lookback, which begins reading Mark's income in 2029 for his 2031 enrollment.
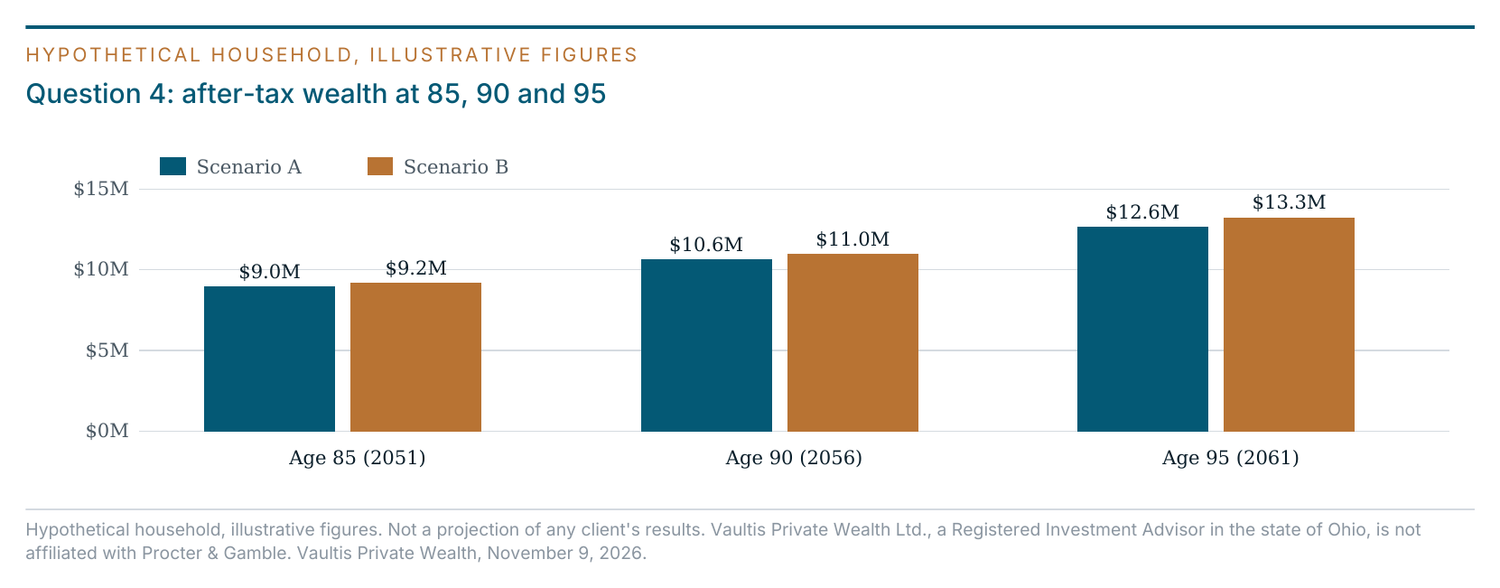
At age 95, Scenario A ends with more gross wealth and Scenario B with more after-tax wealth: about $13.95 million against $13.46 million before the tax still owed on the IRA, and about $12.65 million against $13.26 million once that tax is counted at 30%. Scenario B is ahead as soon as the eventual rate on the remaining pre-tax balance exceeds about 11% on the central path, or about 19% on a flat one, and no realistic heir or surviving spouse pays less than that. For this household the analysis recommends Scenario B. We still show both, because the household is choosing to pay about $557,000 of additional tax over the conversion window in exchange for the later result, and that is their decision to make with the numbers in front of them. The choice also reaches back to the common shares: a household choosing Scenario B has less reason to use NUA on the common, and a household choosing Scenario A has more.
The Spending Stress Test: How Much Room Above $15,000
Once the funding scenarios are set, the next question is how much they could carry. We answer it with a spending stress test. The analysis is rerun at higher monthly spending levels, in steps, two ways: on a straight-line return assumption with no bad years, and across 2,000 simulated futures with random return sequences and random P&G prices.
Success is defined concretely. A future succeeds if the full spending is paid every year and liquid assets never fall below a floor, which for this household might be set at $3 million through age 95. The result is a ladder. For Mark and Dana under Scenario B, $15,000 a month holds in about 76 of 100 futures. $17,500 holds in about 62. $20,000 in about 46. $22,500 in about 30. $25,000 in about 19. Scenario A scores higher at the planned spend, about 84, because it has not paid the conversion tax up front; that is the price of Scenario B's later advantage, stated in the one place it shows up as a cost. The conversions themselves shrink as spending rises, from about $1.40 million at $15,000 to about $950,000 at $25,000, because more of the bracket goes to funding the lifestyle. Somewhere on that ladder the plan stops being comfortable, and the household can see where.
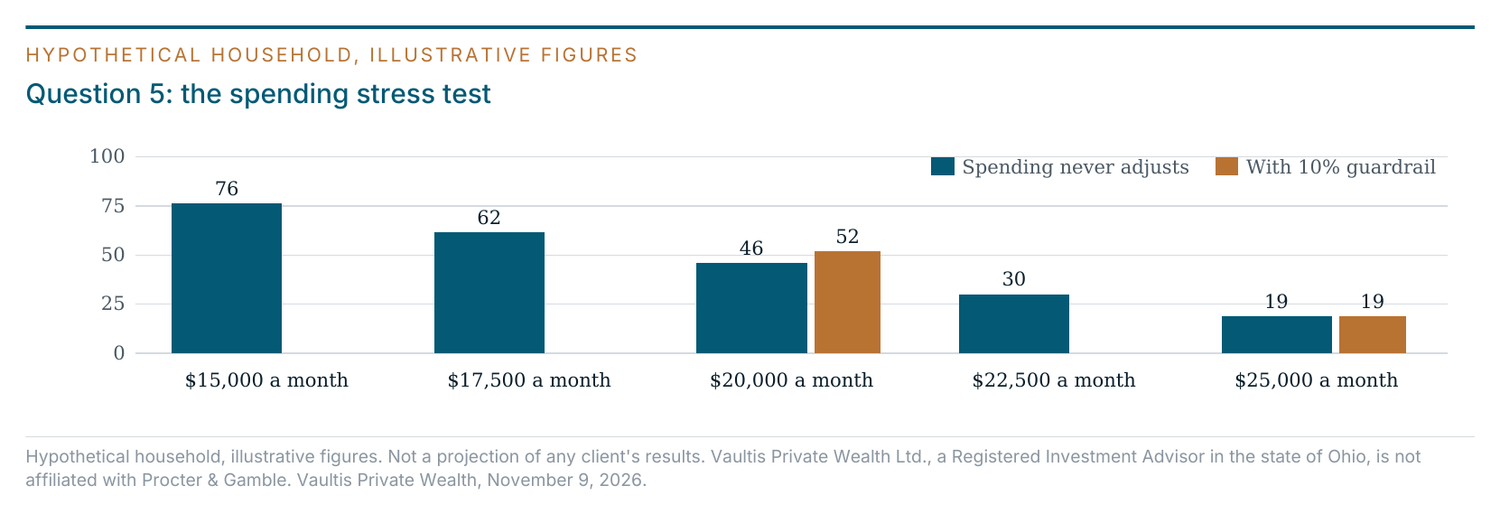
The test is deliberately pessimistic. Spending never adjusts, both spouses live to 95 at full spend, the house is excluded, and nothing is sold early. Then we show what one adjustment rule is worth: trim spending by 10% in any year the balance sits more than 20% below the planned path, and restore it when the balance recovers. For this household that rule lifts the $20,000 level from about 46 to about 52 of 100 and does nothing at $25,000, where the straight-line projection itself runs out before 2061. The rule is the kind people can live with; it does not rescue a spending level the plan was never built to carry. The ladder is rerun each year, and the spending level is set against it.
The Tax Analysis, Prepared for CPA Review
Each tax year gets its own analysis, built with and for our partner CPA, who prepares and files the return. It has a build-up of every income item with its source, the deductions as they will land, the federal and state tax, the withholding and estimated payments and how each is covered, and two short lists: what was resolved since the last version, and what is still open.
For 2027 the document would show Mark's final quarter of wages, the PST distribution with its Box 2a basis and Box 6 NUA, the rollback with its date, share count, and value supported by the monthly statement, the dividends on the NUA shares, and the first brokerage sales for lifestyle. For 2028 it shows about $240,000 of option income, about $45,000 of dividends, about $151,000 of gain on that year's NUA sale, and the $213,000 conversion beside them: roughly $115,000 of federal income tax plus $7,000 of net investment income tax, and about $17,000 to Ohio. P&G withholds 22% federal on the exercise, about $53,000, which leaves roughly $69,000 to cover through estimated payments, or about $27,000 under the prior-year safe harbor with the balance due in April. The conversion alone accounts for about $51,000 of the federal tax. For 2029 it adds a note that this year's income sets Mark's Medicare premiums when he enrolls in 2031.
The cycle runs three times a year. A mid-year strategy meeting reviews the prior return and maps the current year. A year-end action meeting sets the exercise size, the conversion amount, and the final sales with the year's income known. Then the partner CPA prepares and files. The people who modeled the distribution are the people who report it, so the questions that usually fall between an advisor and an accountant get answered by the same team. Tax Planning for Your P&G PST and Savings Plan Distribution describes that arrangement in more detail.
The Investment Plan Gets the Same Treatment
The investment work starts by counting. P&G exposure for this household is the 6,900 NUA shares in the taxable account, the 6,400 common shares now in the IRA, and 26,000 option shares whose value moves dollar for dollar with the price. On the day after the distribution, that is still more than half of the household's wealth.
We evaluate P&G the way we evaluate any single stock: on its investment characteristics, its valuation, and the role it can reasonably play in a portfolio, not on where it came from. The question is how much P&G a household should hold given everything else it owns, and the answer is almost always less than half. Bringing it down is a combination of strategies. The NUA shares are sold down evenly over seven years, 2027 through 2033, funding the lifestyle the options don't cover; their zero basis means every sale is a taxable gain, which is why the schedule is seven years and not one. The common shares in the IRA carry no tax friction and can be sold on a schedule, or immediately; the model sells them in three roughly equal tranches from 2027 through 2029. The options are already on a schedule, and the price view that shapes the exercise timing shapes the sales as well. Managing Concentration Risk After NUA as a P&G Retiree walks through the choices.
The diversified portfolio is built from the analysis outward. The funding scenarios set the return the household needs and the drawdown it can tolerate, and the allocation follows from that, not from a questionnaire. Holdings are low-cost and fully transparent, so the client sees every position and what each one costs. The allocation is tested against the same return assumptions and the same spending ladder the funding analysis uses, so a household never holds two plans that disagree with each other.
Considered and Set Aside
We model nearly every scenario we can think of for a household. Most of them are not delivered. The analysis documents the few with the highest likelihood of success and the best fit for the household's facts, and the rest are set aside with a line on why. For Mark and Dana the set-aside list includes NUA on all 6,400 common shares with the rollback, which sends about 4,400 shares back to the IRA in total and ends the plan about $168,000 behind Scenario B after tax. Converting the entire $2.76 million IRA in 2027, which costs about $1.04 million of tax at a 38% effective rate. Continuing conversions through 2040, another $1.37 million converted, which ends about $504,000 behind. Selling all the NUA shares in 2027, which pays about $237,000 of tax on $1.04 million of gain in the year that already carries the first option exercise. And a gentler version of Scenario B, converting only to the top of the 22% bracket, which ends about $481,000 behind and leaves the surviving spouse with a required distribution near $296,000, still in the 32% single bracket. Each of these was run. Each has a number attached to why it isn't in the recommendation.
What Gets Decided Now, and What Waits
Most of what is described here is decided year by year, with the information available at the time. The exercise size, the conversion amount, the sales for lifestyle, the spending level: all of them wait for the year's actual income and the year's actual price. A few items run on the calendar instead. The lump-sum distribution has to be completed in a single tax year with both plans to zero, and a Roth conversion has to be done by December 31 of the year it is meant to land in. The model exists so that those calendar items are set with everything else already worked out around them.
Then it gets rerun. Every year as a matter of course, and in between when something moves: a market decline in year two, a P&G announcement, a house sale, an inheritance, a health change. On the estate side, we attend the household's first meeting with their attorney, keep beneficiary designations current on the accounts we manage, and revisit the plan when life changes it.
What the Dynamic Advisory Fee Covers
All of this work, including the partner CPA's, is covered by the Dynamic Advisory Fee, a percentage-based fee with a built-in dollar cap. The cap limits what a household pays as the portfolio grows. It does not limit what the plan covers.
Frequently Asked Questions
Do you run this analysis before someone becomes a client?
We outline it. Before someone becomes a client we lay out the decisions in their situation, how we would model each one, and what the process and the documents would look like, so they can see how we think before they commit. The exact figures are dialed in once we have complete statements, grant agreements, and Social Security records in hand.
How many PST distribution scenarios do you model?
As many as the household's facts require. At a minimum: a full rollover with no NUA, NUA on the preferred shares only, and NUA on the preferred plus the common, each with and without the Frank Duke rollback. The answer frequently sits between those points, with NUA on part of the common, and the model is built to test that.
What happens to the plan if P&G stock drops after I retire?
The plan already contains that case. Every option grant has a scheduled year and a plan for what happens if it is out of the money that year, and the funding scenarios are run on a declining price path alongside the flat and rising ones. A drop changes which scenario the household is living in, not whether there is a plan for it.
Do I need to decide on NUA before I retire?
No. The distribution decision is made after separation and executed in a single tax year, and it can be made with the rest of the plan already modeled. What matters is not taking a partial distribution first, since that uses up the separation triggering event.
Who prepares my tax return in the distribution year?
Our partner CPA, working from the same analysis the plan is built on. The distribution-year return has several moving parts, including the Form 1099-R basis and NUA figures and the rollback documentation, and having the preparer involved from the planning stage is the point of the arrangement.
How often is the plan updated?
Every year as a matter of course, with the option schedule, the conversion sizing, and the year's funding sources reviewed against actual income and the actual P&G price. In between, it is reissued when something changes the picture.
Disclaimer: This article is provided for informational and educational purposes only and should not be construed as investment, tax, or legal advice. The household presented is hypothetical and does not represent an actual Vaultis Private Wealth client, but reflects common planning considerations for Procter & Gamble employees. All figures, including success rates, balances, and required distribution amounts, are illustrative assumptions and are not projections of results any client should expect. Individual circumstances vary, and strategies described may not be appropriate for every investor. Tax laws are subject to change, and this content reflects laws as of November 2026; consult a qualified tax professional before acting. Vaultis Private Wealth is a registered investment adviser offering advisory services in jurisdictions where it is appropriately registered or exempt from registration. Vaultis Private Wealth is not affiliated with Procter & Gamble. Tax and estate planning decisions should be reviewed in consultation with a qualified tax advisor or attorney.